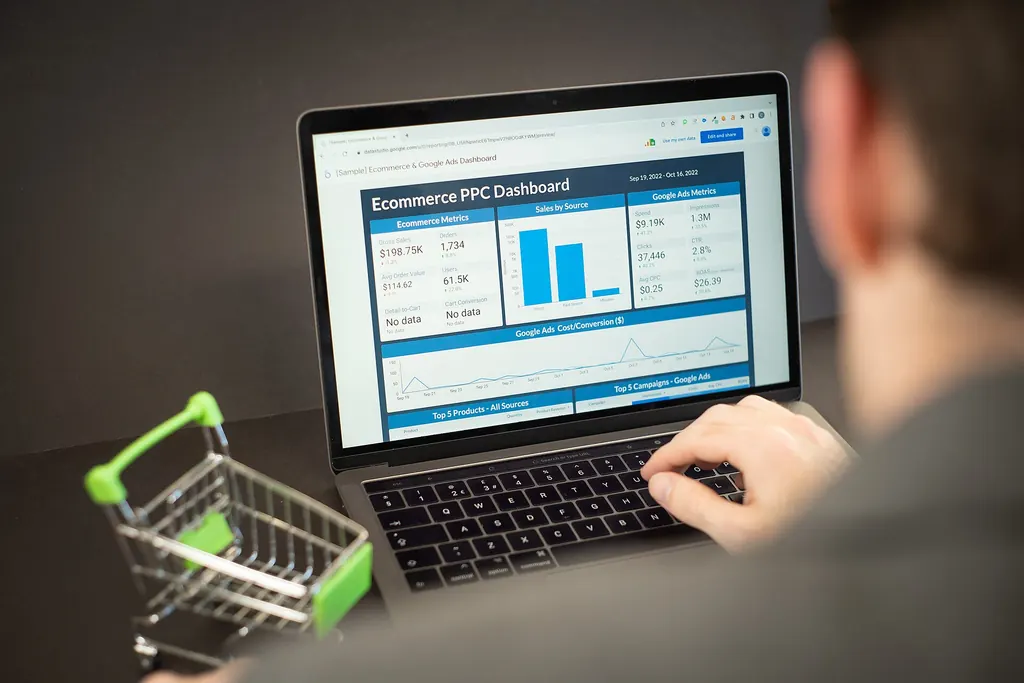
Most businesses can tell you how many blog posts they published last quarter. Far fewer can tell you which of those posts brought in enquiries, and almost none can say whether the whole programme paid for itself. This guide shows you how to measure content marketing ROI in a way you can repeat every month: what to count as cost, which metrics to track, how to give credit across a long buying journey, and what to do with the numbers once you have them.
What content marketing ROI actually measures
Content marketing ROI compares the money your content brings in with everything it costs to make, publish, promote and maintain. It is not the same as traffic. A post can pull thousands of visits from people who will never buy, while a specialised comparison guide read by a few hundred qualified prospects quietly fills your sales pipeline.
The formula is the same one you would use for any investment:
ROI = (Revenue attributed to content − Content investment) ÷ Content investment × 100
Count the full investment
Teams tend to undercount cost, which inflates ROI. Include:
- Strategy and keyword research
- Writing, editing and subject-matter review time (internal salaries count, not only freelancer invoices)
- Design, video and illustration
- On-page SEO and publishing
- Software: SEO tools, CRM, email platform, analytics
- Paid promotion and distribution
- Ongoing updates to existing content
A worked example
These figures are made up, but the method is real. Say a company spends ₹4,00,000 over six months on a cluster of articles, a downloadable guide and the promotion around them. Over the next twelve months, CRM records show deals worth ₹16,00,000 where those assets were part of the buyer's journey.
| Metric | Value |
|---|---|
| Revenue attributed to content | ₹16,00,000 |
| Content investment | ₹4,00,000 |
| Net return | ₹12,00,000 |
| ROI | 300% |
A 300% ROI means every rupee spent came back as four (the original rupee plus three). Two caveats make this number honest:
- Use gross profit, not revenue, if your margins are thin. ₹16 lakh of revenue at a 30% margin is a very different story.
- "Attributed" has to be defined. Is it last-click, or any deal where content was a touchpoint? Pick a rule, write it down and keep it consistent, otherwise month-on-month comparisons mean nothing. The attribution section below covers this.
Set goals before you measure anything
Different content does different jobs, and judging every piece by the same metric leads to bad decisions, such as cutting the educational articles that feed your best leads.
 Photo: Shixart1985 · CC BY 2.0 · Wikimedia Commons
Start with the business objective, then pick the measure that proves it:
| Business objective | What success looks like |
|---|---|
| Win more organic visibility | Growth in impressions and clicks for target topics |
| Generate leads | Form submissions, consultation requests, demo bookings |
| Drive online sales | Purchases from sessions that started on content |
| Shorten the sales cycle | Fewer days from first touch to closed deal for content-touched leads |
| Retain customers | Lower churn and more repeat purchases among readers of help content |
Make each goal specific and time-bound. "Increase traffic" is not a goal. "Get 40 qualified consultation requests a quarter from blog content by March" is one, and every later decision about topics, formats and promotion can be judged against it.
Map content to the funnel
Content earns its keep at different stages, so measure it at the stage where it is supposed to work.
| Stage | Typical content | Signals to watch |
|---|---|---|
| Awareness | How-to articles, explainers, industry guides | Impressions, organic clicks, new users, rankings |
| Consideration | Comparison articles, buying guides, webinars, downloadable resources | Engaged sessions, returning visitors, downloads, email sign-ups |
| Decision | Case studies, pricing pages, FAQs, product demos | Consultation requests, demo bookings, conversion rate, closed revenue |
| Retention | Onboarding guides, knowledge base, product updates | Support ticket deflection, renewals, upsells, referrals |
An awareness article that never converts directly can still be your most valuable asset if it appears early in the journeys of your biggest customers.
The KPIs worth tracking
Resist the urge to report every number your tools produce. A focused set tied to your goals is far more useful than a forty-row spreadsheet.
Visibility
- Impressions and clicks from Google Search Console, per page and per query
- Organic click-through rate, which shows whether your titles and descriptions earn the click
- Breadth of rankings: how many relevant queries you appear for, not just a handful of vanity keywords
- Referring domains linking to your content
Engagement
- Engaged sessions and average engagement time in Google Analytics 4 (GA4 leads with engagement rate; its bounce rate is simply the inverse)
- Scroll depth and internal link clicks, which show whether people read on and go deeper
- Returning users, a good sign that content is building an audience
Leads and conversions
- Key events in GA4 (Google renamed "conversions" to "key events" in 2024): form submissions, calls, downloads, sign-ups
- Lead quality: split marketing qualified leads (MQLs) from sales qualified leads (SQLs). Five hundred low-intent newsletter sign-ups rarely beat twenty serious consultation requests.
- Conversion rate by landing page, to find which content actually moves people
Revenue and efficiency
- Revenue or pipeline influenced by content, from your CRM
- Customer acquisition cost (CAC): total content spend divided by customers it helped acquire
- Customer lifetime value (CLV)
- Sales enablement use: how often sales sends a guide, case study or comparison to prospects. This value rarely shows up in analytics, so ask the sales team.
CLV matters more than most teams realise. If a client's first project is worth ₹50,000 but the typical client stays three years and spends ₹4,00,000, judging content only on first-purchase revenue understates its value by a wide margin. Comparing CLV to CAC is the clearest single view of whether content is an efficient acquisition channel.
Attribution: who gets credit for the sale
Real buying journeys are messy. A prospect might find you through a blog post, come back two weeks later via Google, subscribe to your newsletter, attend a webinar and only then book a call. If the booking page gets all the credit, the content that started and nurtured that journey looks worthless.
The common models:
| Model | How credit is assigned | Good for | Weakness |
|---|---|---|---|
| First-click | All to the first touchpoint | Seeing which content introduces new buyers | Ignores everything that nurtured the deal |
| Last-click | All to the final touchpoint | Simplicity; seeing what closes | Undervalues educational content |
| Linear | Equal share to every touchpoint | Showing that content works as a system | Treats a glance and a deep read the same |
| Time-decay | More credit to touchpoints nearer the sale | Short, recent-heavy journeys | Undervalues early discovery content |
| Data-driven | Credit estimated from your actual conversion paths | Accounts with enough conversion volume | Needs data; less transparent |
An important correction on tools: Google Analytics 4 no longer offers first-click, linear, time-decay or position-based models. Google retired them in 2023, and GA4 now offers data-driven attribution (the default) and last-click options. GA4's attribution paths report (under Advertising; formerly called conversion paths) still shows the touchpoints leading up to key events, which is often enough to see where content appears in the journey. If you want rule-based multi-touch models, you will need to build them from exported data in a warehouse or BI tool, or use your CRM's attribution reporting. Google's own GA4 attribution documentation explains the current options.
For most small and mid-sized businesses, a practical approach is:
- Use GA4's data-driven model as your default view.
- Ask "How did you hear about us?" on every enquiry form and log the answer in the CRM.
- Record the first landing page and the content touched before each lead converts, and review closed deals quarterly to see which assets keep showing up.
Self-reported answers are imperfect but often surface content that analytics misses.
The tool stack
You do not need an enterprise platform to do this well. A sensible stack for most SMBs:
- Google Analytics 4: on-site behaviour, key events, attribution paths and attribution
- Google Search Console: impressions, clicks, CTR, average position and indexing, straight from Google. See Google's Search Console performance report guide.
- An SEO tool such as Semrush or Ahrefs: keyword research, competitor content, backlinks and content gaps. Their traffic numbers are estimates; trust Search Console for your own site.
- A CRM such as HubSpot, Zoho CRM or Salesforce: the only place content can be connected to pipeline and closed revenue
- Looker Studio or another BI tool: one dashboard that pulls the rest together
The single most valuable step is connecting your website data to your CRM. Capture UTM parameters and the first landing page in hidden form fields so every lead record carries its source. Without that link, you can measure traffic but not return. If your tools don't talk to each other, our CRM integration work is usually where we start.
Build a dashboard people will actually read
A good content dashboard answers three questions:
- Are we attracting the right audience?
- Is that audience turning into qualified leads?
- Is content contributing to revenue?
| Section | Metrics |
|---|---|
| Visibility | Impressions, organic clicks, CTR, ranking queries |
| Engagement | Engaged sessions, engagement time, returning users |
| Leads | Key events by content page, MQLs, SQLs |
| Revenue | Pipeline and closed revenue influenced by content, CAC |
| Investment | Spend this period, cumulative ROI |
Keep two views. Leadership needs a one-page summary of business impact, refreshed monthly. The marketing team needs a more detailed operational view to decide what to write, update or promote next. If your data is spread across several systems, a lightweight business intelligence setup saves hours of manual reporting every month.
How to improve content marketing ROI
Measurement only pays off when it changes what you do next. These are the levers we see work most consistently.
Double down on what already works
When a page reliably brings in traffic, qualified leads or links, build around it: supporting articles on related questions, a downloadable checklist, a webinar or a short video. Internal links from the new pieces strengthen the original.
Refresh before you rewrite from scratch
Updating a page that already ranks is often cheaper and faster than publishing something new, because it already has visibility and links. A refresh might include:
- Updating facts, screenshots and examples that have gone stale
- Re-checking that the page still matches search intent for its main query
- Tightening the title and meta description where CTR is low
- Adding a short FAQ that answers questions from Search Console query data
- Improving internal links to and from related pages and your service pages
Check Search Console for pages with high impressions but low CTR, or pages whose clicks have slid over several months. Those are usually your fastest wins.
Diagnose underperformers before deleting them
For content that isn't working, check search intent, accuracy, competing pages and internal links. Many weak pages can be fixed; others should be merged into a stronger page and redirected. A quarterly audit can sort every page into one of four buckets:
| What the data shows | Action |
|---|---|
| Brings in leads or revenue, traffic stable or growing | Promote it and build supporting content around it |
| Converts steadily, nothing to fix | Maintain; check facts once or twice a year |
| Once performed well, clicks sliding for several months | Refresh it |
| Little traffic, no leads, no links after a year | Merge into a stronger page and redirect, or retire |
Repurpose and distribute on purpose
One well-researched article can become a LinkedIn series, a newsletter, a short video and a sales one-pager, so you pay for the research once and earn from it several times. Plan distribution for each piece too (email list, LinkedIn, industry communities, partners, internal links from high-traffic pages). Content no one sees cannot return anything.
Align marketing and sales
Agree with sales on shared definitions (what counts as an MQL, what counts as content-influenced revenue) and review them together. The questions prospects ask on sales calls also make excellent content.
Use AI as an assistant, not an author
AI tools are useful for clustering keywords, spotting content gaps, summarising competitor pages and drafting outlines. They do not replace first-hand expertise. Google's guidance is to create helpful, reliable, people-first content, and with AI Overviews now answering many basic questions directly in search results, generic content has even less chance of earning a click. Content that shows real experience, specific examples and a clear point of view is what keeps paying back.
Common measurement mistakes
- Judging too early. New articles often take several months to rank and accumulate links. Review content on a six to twelve month horizon, not six weeks.
- Ignoring cross-device journeys. Without CRM integration, a prospect who reads on mobile and enquires from a laptop can look like two people.
- Tracking gaps. Cookie-consent banners, missing cross-domain tracking (for example, a separate booking or payment site) and offline touches such as phone calls and WhatsApp chats all hide content's role. Test your tracking end to end, and log offline touches in the CRM.
- Inconsistent data. If marketing and sales use different definitions and tools, reports will disagree and trust in the numbers will collapse.
Key takeaways
- Define one measurable business goal for each content cluster before you publish.
- Count the full cost, including internal time and maintenance.
- Track a small set of KPIs per funnel stage, not every available metric.
- Connect website data to your CRM with UTMs, first landing page and a "how did you hear about us" field.
- Use GA4's data-driven attribution and attribution paths, and supplement with self-reported attribution.
- Factor in customer lifetime value, not just first purchase.
- Review monthly, judge on a six to twelve month horizon, and refresh your best pages before writing new ones.
If you want help deciding what to publish and how to prove it is working, take a look at our content strategy service or book a free consultation for a no-obligation chat; we'll be happy to help. If it's a fit, we can also help make your website DPDP-compliant, from consent on your forms to how you store leads.